Blog Article

Paint a Picture with Your Data

Written by: Natalie Komitsky

Paint a Picture with Your Data icon

Are you familiar with the phrase, “Show, don’t tell?” It describes a writing technique that encourages writers to create such detailed sensory descriptions that readers feel as if they can hear, see, taste, touch, and smell, just as they would if they were experiencing it themselves.

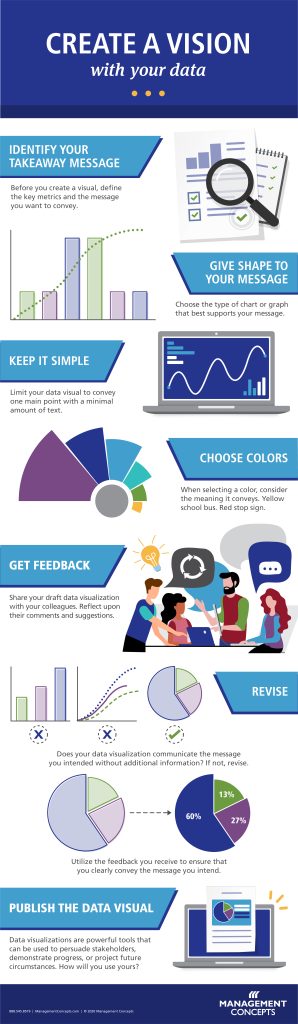
Just as “the lingering scent of burning leaves in a desolate autumn night” paints a picture in your mind, your ability to Create a Vision with Your Data will have a significant impact on how your analysis is perceived. The infographic below describes how to create a data visualization, step-by-step.

Are there any other federal government training topics that you’d like to see as an infographic?

We’d love to hear from you.

Sign Up For Our Blog

Related Resources

See All
Webinar

AI and Data Ethics: Proceed with Caution

Watch our AI and Data Ethics: Proceed with Caution webinar, that discusses the expected benefits and inherent risks of such emerging technology.

Watch
Video

Analytics Training For Every Government Professional

Explore how our analytics training helps federal professionals at any career stage to understand and analyze data with this short video.

Watch
Blog Article

Top 10 Reasons Everyone Working in the Federal Government Needs to Understand Analytics (AN)

In the digital era, where data reigns supreme, understanding analytics has become a crucial skill set across all sectors.

Read More
Infographic

Microlearning

Learn more on how Microlearning delivers bite-sized “nuggets of knowledge,” exactly when and where you need them, boosting retention with quick bursts of focused, engaging content.

Download
Webinar

Telling the Story: How to Present Data Analytics Findings Effectively to Stakeholders

Discover how to contextualize data to convey a compelling story so you can influence decision-making process to achieve alignment with your colleagues.

Watch
Blog Article

Navigating the Evolving Federal Acquisition and Contracting Landscape: Trends and Challenges

Read More
Infographic

Create a Vision with Your Data

Dive into this infographic, which explores the steps you can take to tell a visual story with your data.

Download
Blog Article

A Federal Employee’s Introduction to Analytics

Read More
Blog Article

Choosing the Right Analytics Certificate Program as a Federal Employee

Read More
Blog Article

A Federal Employee’s Guide to Risk Assessment

Employees working in federal organizations face many day-to-day challenges. Federal workers must carefully analyze the problems and devise effective solutions to overcome the rising challenges.

Read More

Scroll to view more

See All
chat popup